


Month: August 2015
Návrat k zlatému štandardu

Prečo sa nevrátime k zlatu?
Geopolitická politická a ekonomická štruktúra sa mení. Menia sa aj záujmy investorov. Z jednoduchého dôvodu. Ekonomický vývoj je čoraz menej predvídateľný. V budúcnosti nebude zaujímavé len investovanie do cenných papierov, ale aj do iných nástrojov. Veľkú úlohu budú mať v tejto oblasti suroviny a spomedzi nich najväčšiu bude mať zlato.
Zlato sa ako platidlo používa odnedávna. Diskusie o úlohe zlata sa objavili najmä v rokoch 2008 – 2009 keď prepukla svetová finančná kríza. Niektorí ekonómovia tvrdia, že svet by sa mal vrátiť k zlatému štandardu. To znamená, že všetky bankovky na svete by mali byť kryté vzácnym žltým kovom. Peniaze by sme mohli vymieňať za zlato a naopak. Zlato sa používa v niektorých priemyselných odvetviach ako je letecký priemysel a medicínska technika, šperky a podobne. Zlato má však najväčší význam v oblasti svetových financií. Znižuje infláciu a zabezpečuje stabilitu meny. Práve preto ho nakupujú centrálne banky, ktoré do neho ukladajú svoje rezervy.
Kanadská komerčná banka Scotia bank hovorí vo svojej analýze o vplyve rôznych faktorov na cenu zlata. Sú tri: obavy z gréckej dlhovej krízy, pokles investícií na čínskom kapitálovom trhu o takmer tretinu, a očakávaný návrat iránskej ropy na svetový trh. Cena zlata bola začiatkom augusta 1089 amerických dolárov (USD) za uncu (31,1 gramu). Celková hodnota zásob zlata vo svete je 6,35 biliónov USD. Podiel zlata na celkových devízových rezervách jednotlivých krajín sa odlišuje: USA (74%), Nemecko (68%), Taliansko (67%), Francúzsko (65%), Rusko (13%).
Ak porastú v budúcnosti ceny zlata, klesnú ceny tovarov. Ak by sa tak nestalo bola by deflácia. Ak by sa krajiny raz rozhodli, že sa vrátia k zlatému štandardu, stúpol by záujem o zlato, čo by tiež viedlo k znižovaniu cien. To vedie k jednoduchej otázke. V minulosti bol zlatý štandard ochranným dáždnikom pre kapitálové toky vo svete.
Prečo sa krajiny nevrátia k zlatému štandardu? Dnes je to hlavne preto, lebo celý finančný systém je postavený na dominancii papierových peňazí a zlato je už len doplnkom daného systému. Pri prechode na zlatý štandard je veľmi nepravdepodobné, že by krajiny mali k dispozícii toľko zlata, aby sa vyrovnali hodnote papierových peňazí. Prečo svetové ekonomiky ustúpili od zlatého štandardu? Ekonomické a finančné krízy oslabili jeho postavenie. Pre ich riešenie vlády najradšej používali a používajú tlačenie papierových peňazí. Napriek tomu po zlate je dopyt aj dnes. Spomedzi najväčších producentov zlata na svete patrí juhoafrická firma Harmony Gold Mining, ktorá vyťažila minulý rok 1,17 milióna uncí.
História zlata ako investičného nástroja sa píše od čias starobylého Grécka a Ríma. Zlato sa vymieňalo za koreniny z Indie a hodváb z Číny. Aj v budúcnosti môže zlato hrať úlohu uchovávateľa hodnôt. Taktiež sa vnára otázka, čo by mohlo zvýšiť záujem o zlato do budúcnosti? Jednoduchá odpoveď, monetarizácia zlata, teda okamžitej výmeny zlata za peniaze. Môže sa stať, že dlžníci z rozvinutých krajín skúpia väčšie množstvo zlata, pretože sa boja nekrytých peňazí, potom ich dlh bude znehodnotený, tým pádom ceny zlata porastú. Každý investor by mal mať vo svojom portfóliu zahrnuté investície do komodít (surovín). Inak povedané, koncept peňazí, teda zlata a striebra v štandardnej hmotnosti a mince, umožnili svetovým ekonomikám rozšíriť a prosperovať. Nevieme či to bude aj v budúcnosti, dnes sa na zlato pozeráme najmä na jeho podobu vo forme šperkov a náhradu zúbkov.
(C) All Rights Reserved
Analysis of Research and Development
Aký je rozvoj vedy a výskumu? = just for your information because no publisher in SR wanted my articles to be seen and understood by public.
Aká je úloha štátnych rozpočtov jednotlivých krajín? Predsa pokryť náklady spojené s fungovaním a zabezpečením potrieb štátu. Výdavky do vzdelávania, vedy, výskumu a vývoja by mali byť samozrejmosťou každého štátu, pokiaľ chce prichádzať s novými inovačnými technológiami a produktami. To si tiež vyžaduje stimulovať, motivovať a odmeňovať vedeckých pracovníkov pôsobiacich v oblasti školstva.
Pokiaľ sa pozrieme na výdavky na vzdelanie v štátnom rozpočte v Slovenskej republike, tak podľa údajov z OECD predstavujú čiastku 14,546 mln EUR v roku 2014, v porovnaní s rokom 2006 je badateľný nárast o 514, 90% a oproti roku 2013 sa výdavky zvýšili o 73,08%. Načŕta sa otázka, počet vysokých, stredných škôl k počtu obyvateľov. Ako sa starajú školy o svojich študentov? Ako si vážia školy študenta? Ako školy pristupujú k poskytovaní vzdelávania študentom, a ako študenti pristupujú k získavaniu a nadobúdavaniu nových poznatkov a informácií? Sú učitelia, pedagogickí pracovníci spravodlivo odmeňovaní? Je potrebné zmeniť systém na SR? Jednoznačná odpoveď.
Dok1 Zdroj: Autorove spracovanie na základe údajov z OECD, 2013
Pokiaľ sa pozrieme na výdavky na vzdelanie v štátnom rozpočte v Českej republike, tak podľa údajov z OECD, predstavujú čiastku 344,168 mln Czech koruna v roku 2014, v porovnaní s rokom 2005 je značný nárast o 339,98% a oproti roku 2013 sa výdavky zvýšili o 34 mln czech koruna. Vidíme odliv mozgov, predovšetkým zo SR do tejto susedskej krajiny, aj z dôvodu nízkej jazykovej bariéry. Výdavky na vzdelanie v poľsku dosiahli sumu vo výške 257,2 mln zlotych v roku 2013.
Zdroj Zdroj: Autorove spracovanie na základe údajov z OECD, 2013
V maďarsku je situácia, že vládne výdavky do vzdelávania tvoria sumu vo výške 1194,9 mln forintov v roku 2013, je značný nárast o 870,84% oproti roku 2007, a nárast o 884,2 mln forintov oproti roku 2012.
Dok3
Zdroj: Autorove spracovanie na základe údajov z OECD, 2013 V nemecku vládne výdavky do vzdelávania sú vo výške 313,511 mln EUR v roku 2014, je značný pokles o 49,98% oproti roku 2005, a nárast o 67 mln EUR oproti roku 2013.
Dok4 Zdroj: Autorove spracovanie na základe údajov z OECD, 2013 Situácia vo Veľkej Británii je nasledovná, výdavky na vzdelávanie sú vo výške 36,2 mln pounds in 2013, na druhej strane je značný pokles o 29,49% v roku 2006.
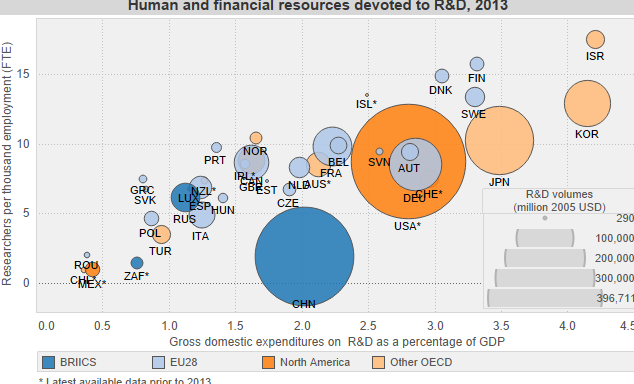
Podiel HDP do výskumu Z pohľadu ľudských a finančných zdrojov v porovnaní podiel HDP, spracované OECD, je veda a výskum v roku 2013 situovaná z geografického hľadiska v krajinách BRIICS, Severná Amerika, Japonsko, Kórea. Načŕta sa otázka, koľko dávajú jednotlivé krajiny do rozvoja vedy a výskumu z podielu HDP. Pokiaľ sa pozrieme na štáty V4, tak česká republika investuje 1,92% z HDP, maďarsko 1,41%, poľsko 0,87% a slovenská republika len 0,83% z HDP investuje na podporu vedy a výskumu. Na druhej strane, je potrebné spomenúť krajiny, ktoré si uvedomujú ako investície do vedy a výskumu dokážu priniesť inovácie, start-upy, patenty. Napríklad Izrael investuje do vedy a výskumu 4,21% z HDP, 4,15% z HDP investuje Kórea, Japonsko 3,47% z HDP, Fínsko 3,31% z HDP, Švédsko 3,3% z HDP, Dánsko 3,06% z HDP, Nemecko 2,85% podľa údajov z OECD, dostupný dáta z roku 2013.
Patent, predstavuje ochranný dokument, udelený štátom a dáva majiteľovi právo zakázať inej osobe, aby pri svojej akejkoľvek činnosti vyrábala alebo dávala na trhu vynález bez súhlasu majiteľa. Inak povedané, pokiaľ nejaký človek vyvinie unikátny výrobok, proces, postup, tak si ho dá patentovať, že je to jeho 100% vlastníctvo. Z geografického pohľadu, v roku 2013 podľa OECD, 1785 je evidovaných patentov v Číne, v Európskej Únii je to 14 161.6 patentov, v Nemecku je registrovaných 5 465.2 patentov, v Japonsku je to 15 970.1 patentov, v Kórei je to 3 154.4, v USA je zaevidovaných 14 606.2 patentov, v UK je to 1 769.9. V slovenskej republike je registrovaných 11,2 patentov. Je potrebné dodať, že poznáme 3 veľké patentové úrady: the European Patent Office (EPO), the Japan Patent Office (JPO) a the United States Patent and Trademark Office (USPTO). Daný indikátor je vypočítaný podľa krajiny bydliska, dátumu.
Aký je počet vedeckých pracovníkov resp. ľudí pracujúcich v oblasti vedy a výskumu? V Číne sa oblasti vedy a výskumu venuje 12.777 ľudí, v Dánsku je to 14.863 ľudí, vo Fínsku 15.681, v Kórei 12.840, vo Švédsku je to 13.323, v Nórsku je to 10.420 ľudí. Francúzsko reprezentuje 9.806 vedeckých pracovníkov v roku 2013 podľa dostupných dát z OECD.
(C) All Rights Reserved, Not published in any journal or newspaper yet, feel free to contact me directly in order to sign lucrative contract with MY conditions.
Analysis of Oil and Gold

Table of Content
Introduction. 3
1 Oil 3
1.1 The Case study of India. 4
1.2 Motivation for energy efficiency. 6
1.3 Effects of the energy price. 7
2 Gold. 8
2.1 Great Depression. 8
2.2 Report from Scotia Bank. 10
2.3 Jewellery demand. 11
2.4 China and India. 12
2.5 Gold Standard Valuation. 13
2.6 Kitco Metal´s View.. 15
Conclusion. 15
References. 16
Introduction
To begin with, many developing countries are competing with western economies in their consumption of crude oil. China, India and other emerging countries are at the forefront of this consumption because of which ‘demand’ is a major factor. Although major changes in technology are bringing new renewable and alternative sources of energy, switching from oil to these is restricted in the short-term.
1 Oil
A more recent study by the IMF (2013) sets the overall direct subsidy level at about $400 billion, of which about $270 billion are to oil and natural gas. More than 95% of global subsidized fossil-fuel consumption was in these years concentrated to 37 countries of which 35 were outside of the OECD area.
Although the current upward swing in energy prices has not so far been categorised as, as severe as that of the 1970s, however, it has been enough to renew the interest in predicting the macroeconomic consequences of energy shocks and how recessive the current developments in the world oil markets can be.
Tripathi, S (2014, p. 2) illustrated that from a macroeconomic perspective, households, government, firms (corporations) and central bank are the 4 fundamental players of money and resources. The flowchart diagram as you can see on the Figure 1 above illustrates how they interact and exchange resources. This chart also shows how oil imports get absorbed in different segments, explaining the channels through which oil shocks can affect an economy.
1.1 The Case study of India
Tripathi, S (2014, p. 9-11) examined the impact of an increase in international oil prices on Indian economy outlining the various transmission mechanisms. The three broad channels through which the international oil prices impact the macroeconomy are identified as the (1) import channel, (2) price channel and (3) the fiscal channel.
First, a rise in international price of oil, for the net oil importing countries like India, will translate in to higher import bill for oil. At the same time incomplete pass through of international crude prices to domestic oil prices further lowers the already low substitution elasticity for oil products. Periodic rupee depreciation further raises the rupee value of imports. This slow release through the system, given dysfunctional administered price regimes, keeps inflation high also leading to fall in growth. As incomes fall, especially firm profits, so do savings. The current account deficit must equal investment minus saving by definition. Investment falls in slowdowns, but if savings falls even more, the CAD widens. Financial savings finance investment that requires traded goods imports. So a fall in financial savings may widen the trade and current account deficit more. The current account then becomes the source of disseminating shock in the economy. The import channel is indicated by the link from international oil prices to current account balance to nominal GDP.
Second, the price channel links the international prices to domestic inflation. For a typical developing country like India facing an oil price hike in the international market, an unhindered pass-through of oil price increase leads to a jump in the general price level on account of direct use of oil at higher prices plus increase in costs of production of final goods using oil as an input.
In India according from view of Tripathi, S., the objectives for regulation of price of oil have been three-fold: (1) to protect the domestic economy from volatility in international oil prices; (2) to provide merit goods to all households, e.g. clean cooking fuels like LPG, natural gas and kerosene and (3) to protect poor consumers so that they may obtain kerosene (through PDS) and LPG at affordable rates. The domestic price of oil is administered, which is essentially a policy decision,and thereby determines the degree of pass-through of the change in international prices to domestic oil prices. In Figure 3, the price channel is indicated by the link from international oil prices to increase in administered prices to WPI inflation.
Third, channel of transmission of oil price shock considered here is the fiscal channel. In the absence of a complete pass-through, an international oil price increase will raise the subsidy on oil and therefore the revenue expenditure of the government. Furthermore, in India, the oil prices are subsidized, but they also generate substantial tax revenues both for the center and the states.
Tripathi, S. (2014) also developed in his paper a new-Keynesian model, with imported oil used both in production and consumption. In other words, five different hypotheses for these effects were tested (a) smaller share of oil in production, (b) more flexible labour markets, (c) improvements in monetary policy, (d) Technology Catch-up (e)Government Intervention. His conclusions was that all the five played an important role.
1.2 Motivation for energy efficiency
Most consumers pursue according to the Rosehart, W. D., Zareipourp, H. (2014, p. 7) energy efficiency to save money, reduce the cost of goods sold, or reduce emissions to improve air quality and the environment. In addition to these goals, policymakers use energy efficiency to enable a wide range of desirable social, engineering, and economic goals, normally focused around long-term resource adequacy. Energy efficiency is also often seen as an alternative tool to address long-term energy-demand concerns, compared to building new infrastructure.
Many energy efficiency programs primarily target the end use of the electrical energy sector, since improvements in the production or use of electricity can yield up to three times as much resource savings when compared to increased efficiency in use of other energy forms. In the electric energy sector, efforts to install and integrate demand-side management measures such as smart meters, pricing incentives, new regulations, and new technology deployment offer the potential to reduce system costs and pass on savings to consumers. Furthermore, energy efficiency initiatives can positively reinforce other public programs, such as improving air quality for urban areas, improving personal health, and improving overall competitiveness for employment and export opportunities.
1.3 Effects of the energy price
In his paper Moshiri, S. (2013, p. 16), address the potential effects of the energy price reform as one of the important policy challenges in the energy market and the economy of Iran. Unlike other studies which have focused on one energy type or a specific area, he takes a more comprehensive approach by estimating household energy demand for three main energy types (electricity, natural gas, and gasoline) in urban and rural areas in different income groups .Overall, the results predict that rural households will cut their energy consumption relatively more than urban households if prices of natural gas and gasoline rise. However, the reaction will be stronger in urban areas if electricity price increases. In rural areas, the higher income households will respond more strongly than lower-income groups as prices rise, but in urban areas, the opposite will be true. An interesting observation about the urban low-income families is that their income level and energy consumption as well as their price elasticities of demand is lower than that of the mid- and higherincome rural households. Therefore, it is expected that the urban poor will be affected more severely by an increase in energy prices than rural households with mid- and high-income levels.
His study provides important insights on the distribution and consumption effects of the energy price reform in Iran. They clearly indicate that the impact of the energy price reform will not be homogeneous across households calling for more careful policy packages according to different income groups and regions. The overall low price elasticities of demand for energy, particularly among the households with higher level of energy consumption, also imply that the energy price reform will not have a dramatic impact on the energy consumption. Moreover, the higher income elasticity of energy demand among low- and mid-income groups indicates that any compensation package will likely more than cancel out the price effect on energy consumption.
The factors examined above influence market prices for crude oil fundamentally but there has been increasing role of speculation causing oil prices to rocket according to Kaufmann (2010). One obvious method of trading crude oil is physical but outside that, there are spot and futures markets. These markets are hotbeds for speculators who hoard large stockpiles of crude oil, reducing it supply and in turn create artificial demand. This means that mispricing by the spot and future markets can lead producer of crude oil to keep oil in the ground. But Hamilton (2009) disagrees and suggests that it is possible that supply cuts have been the ultimate cause of the price increases in the recent years instead of speculation. Regardless, it can be noted that speculation is a key factor in price movements as it occurs in markets that do not apply the laws of supply and demand naturally.
2 Gold
What is a gold? Short descriptions provided by Lubbers, E. is that gold is considered a financial asset, not an industrial commodity, like oil or copper. Therefore, the bulk of physical demand for gold comes from investment related items, such as golden jewelry, bars and coins. Viewed in this light, there is also a growing demand from central banks, mainly in emerging markets, who look for ways to diversify their foreign currency holdings. A small amount of gold is used in industries, for example in high-end electronics for the medical, space and aviation industries. Finally a shrinking amount of gold goes towards teeth.
2.1 Great Depression
How is the Great Depression explained today? Modern scholarship regards the Depression as an international phenomenon, rather than as something that affected different countries in isolation. The thread that bound countries together in the economic collapse was the gold standard. Barry Eichengreen’s 1992 book Golden Fetters is most commonly associated with the view that the gold standard was the key factor in the origins and transmission of the Great Depression around the world, although there have been many other contributions to this perspective. While debt and reparations from World War I made the international financial system fragile throughout the 1920s, the real problems began in mid-1928 when the United States and France began attracting large amounts of gold from the rest of the world. This deprived other central banks of the gold reserves that they needed to back the currency they issued, forcing them to tighten their monetary policies. Furthermore, the United States and France did not monetize the gold they received, thus failing to provide an expansion that could have offset the contraction elsewhere. These restrictive policies led to the onset of worldwide deflation starting in mid-1929.
Irwin, D. A., (2011, p. 5) describes that after the war, countries sought to reduce inflation and restore monetary stability, and thereby lay the groundwork for an eventually return to the gold standard. Yet Cassel foresaw a serious risk of deflation as countries moved back to the gold standard. When a country went back on the gold standard, it fixed the nominal price of gold in terms of its currency. If the demand for gold were then to increase, the fixed nominal price of gold would not be allowed to adjust. Rather than the price of gold increasing, the prices of all other goods would have to fall, meaning a general deflation in the price level.
Therefore, for the value of gold (and hence the overall price level) to be kept stable, the supply of gold had to be kept in line with the demand for gold. Cassel’s great fear was that, as countries rejoined the gold standard, central banks would increase their demand for reserves and that this increase in gold demand would outstrip the growth of gold supply, thereby producing deflation. Cassel believed that deflation would inevitably lead to a deep economic depression.
By the end of 1932, there was little point in Cassel belaboring his warnings about the excessive demand for gold on the part of central banks. After Britain led dozens of other countries off the gold standard in September 1931, gold no longer provided the basis for the international monetary system. Only the United States, France, and a few other European countries remained on the gold standard. The gold standard had been almost completely destroyed and there was little left for Cassel to do except try to clarify in the public’s mind what had happened and to squash any hopes of returning to the gold standard presented by Irwin, D. A., (2011, p. 26).
Hayek agreed with Cassel that the mismanagement of the gold standard was the source of the problems in the world economy in the late 1920s. But his analysis of what went wrong was fundamentally different. In Hayek’s view, the economic collapse starting in 1929 was the inevitable consequence of an inflationary boom due to cheap credit that arose because countries failed to adhere to the rules of the gold standard. Any attempt to ease the pain with further inflationary measures would simply make the downturn worse.
These global flows also affected local policy. Countries increasingly coordinated on the gold standard to provide an umbrella of stability for capital flows and commodity trade. By 1880, the leading countries of the world had all given up silver or bimetallic systems while by 1900 the leading countries in Latin America and Asia had also joined the bandwagon (Meissner, 2005).
What conclusions can be drawn from this brief survey of financial crises during the classical gold standard period? First, crises were ubiquitous events in the period of globalization that preceded World War I. Could it be that globalization was a primary cause of these crises? Indeed there seems to be some evidence that capital inflows sowed the seeds of banking, currency and debt crises. These inflows then interacted with other weaknesses creating financial fragility or a heightened potential for a crisis. An alternative possibility is that high levels of credit growth fueled unsustainable asset booms raising the potential for crises. There seems to be very little strong evidence that between 1880 and 1913 credit or money growth was a good predictor of financial turmoil across countries in my sample presented by Meissner, C. M. (2013, p.15).
2.2 Report from Scotia Bank
According to the report from Scotia Bank (2013, p. 2) there are a lot of cross currents affecting the global economy but generally the status quo has been kept and problems that have emerged in the financial/monetary system have been temporarily sorted out before they have turned into crises. Examples being: the US fiscal cliff, the Cypriot debt, Italian elections and the US debt ceiling. As a result of this, institutional investors have regained confidence in the broader financial markets, whether it be peripheral European bonds, the euro, the dollar, or equities – to name a few. While the issues have been tackled, solutions have still not been found and the measures taken have tended to buy time, as has happened all the way through the crisis. One of the main developments in 2013 has been the focus on the ending of quantitative easing (QE).
In the minutes from the December 2012 FOMC meeting that were made public in January, there were some comments about the reining in of QE later in 2013. Whether the prospect of an end of QE sparked concerns that liquidity would be drained from the system and there would be less investment money around, or that the financial crisis was coming to an end and therefore there was a call for optimism, is uncertain. That said, with equities outperforming expectations this year there has been a high degree of optimism and the talk of tapering QE has tended to depress commodity prices, especially the precious metals.
So for now we view the global market as split between emerging markets and developed markets. In the latter, confidence is improving and with equities on the rise and periphery bonds looking less risky, the opportunity cost of holding Gold has risen to the extent that there is little fresh investment interest in the metal. However, the economic climate in emerging markets where individuals are concerned about inflation, governments about their exposure to fiat currencies and where there is a growing middle class with greater disposable income, Gold remains in demand. With hindsight it is not surprising that the marginal shift in supply and demand has resulted in a pullback in prices, but in turn lower prices have encouraged physical buying and that may well now rebalance the market and stabilise prices.
2.3 Jewellery demand
In 2012, jewellery demand dropped around four percent compared with 2011, but weaker prices so far in 2013 have led to a significant rebound in demand. In the first three quarters, jewellery demand has climbed 20% with most regions seeing an increase, the notable exceptions being Europe and South Korea where economic hardship has dented demand. Jewellery demand in India started the year on a strong note, but the combination of a significantly weaker currency and government intervention in the form of excise duties and import restrictions, in an effort to deter imports of Gold, have led to significantly higher Gold prices. For 2014, Scotia Bank expects jewellery demand growth to be nearer five percent, compared to the 20 percent seen so far this year.
2.4 China and India
According to the newspaper Times of India China has overtaken India as the world’s largest gold consumer. While Chinese consumers lapped up 1,066 tonnes of gold products in 2013, their Indian counterparts bought 975 tonnes, up 13% from 2012.
India’s demand came down to 974.8 tonnes following wide-scale curbs imposed by the government to tame hunger for the precious metal. Despite the massive increase in customs duty and many restrictions that the Centre put on jewellery imports, India consumed more gold than 2012, when it stood at 864 tonnes. In China, the total demand stood at 806.8 tonnes in 2012.
China’s gold consumption surpassed the 1,000-tonne mark in 2013 as domestic demand for jewelry and bars surged despite the lackluster global market. Consumption soared 41.36 percent year on year to 1,176.4 tonnes in 2013, nearly triple the amount of its total domestic gold production, according to data by China Gold Association (CGA). The figure is likely to mean that China will take the place of India as the world’s largest gold consumer, under the backdrop that shrinking gold prices and concerns that the Federal Reserve might withdraw its quantitative easing stimulus had dampened market sentiments last year.
The marked increase was mainly attributed to the country’s surging demand for gold jewelry and bars, which increased 42.52 percent and 56.57 percent year on year to 716.5 tonnes and 375.73 tonnes respectively. In the second quarter of 2013, the international gold price dropped to around 1,400 U.S. dollars per ounce from the 1,600-U.S. dollar level, prompting Chinese consumers to go on a shopping spree. China produced 428.16 tonnes of gold in 2013, up 6.23 percent year on year and making it the world’s largest producer for the seventh straight year, data from the association showed.
According to the data from World Gold Council´s report of February 2014 Gold demand of 3,756.1 tonnes in 2013 was worth US$170.4bn. Consumers generated exceptional levels of demand, with jewellery at its highest since the onset of the financial crisis in 2008 and investment in small bars and coins hitting a record high. This was in contrast to large-scale outflows from ETFs, due to a number tactical western investors liquidating their positions as US economic sentiment improved. Central banks made healthy purchases of 368.6 tonnes, the fourth consecutive year of positive demand. The net result was a 15% decline in overall gold demand from 2012.
2.5 Gold Standard Valuation
If we look at on an alternative valuation method for gold, is to look at the gold standard as it was defined in the Bretton Woods period. One can ask the hypothetical question, what if the total global money supply would be backed by the global gold reserve? Since the definition of the money supply is very broad, Lubbers, E. will use the monetary base (MB), like in the Bretton Woods period. The MB is the coins and notes (circulating in public and in bank vaults) plus commercial banks reserve at the central banks. Than he divide the MB by the amount of ounces of gold in the reserve at the central bank.
The last period that the US Dollar was backed by gold was in the Bretton Woods period, between 1944 and 1971. Holders of US Dollars could demand gold at the rate of $35 per ounce. Unfortunately, this option not available to citizens, only foreign central banks, which demanded an ever increasing amount of gold from the US. Between 1945 to 1971, not only demand for the USD as an asset by foreign central banks soared but so did demand to convert USD to physical gold. Soon, the rapid conversion of USD to gold by foreign central banks made the US gold reserve dwindle from 20,000t tonnes to 8,133 tonnes, for more details see Appendix B.
Keith W., (2014) is interested in the changing equilibrium created when some market participants are accumulating hoards and others are dishoarding. Of course, what makes it exciting is that speculators can (temporarily) exaggerate or fight against the trend. The speculators are often acting on rumors, technical analysis, or partial data about flows into or out of one corner of the market. That kind of information can’t tell them whether the globe, on net, hoarding or dishoarding. One could point out that gold does not, on net, go into or out of anything. Yes, that is true. But it can come out of hoards and into carry trades. That is what whe studies.
2.6 Kitco Metal´s View
Murphy, H., trader at Kitco Metals Inc., presented that current trade got some FX volatility after Durable Goods Orders on 24. April 2014 with the Euro dropping to its lows of 1.3788, seen the last two weeks, but then it held again for the fourth time and here we are back in a range. Same goes for most FX pairs. With no key data out of Europe, the overnight session has focused on Ukraine tensions again, with John Kerry’s stating “if Russia continues in this direction, it will not just be a grave mistake, it will be an expensive one. The window to change course is closing. If Russia chooses the path of de-escalation, the international community – all of us – will welcome it. If Russia does not, the world will make sure that the cost for Russia will only grow.” Speaking about expensive, their debt has been downgraded to a notch above junk by S&P, their stock market is currently on its way to a 6% loss for the week, they raised the key rate to 7.5% from 7% today because of inflation fears and Obama is talking to European leaders today to increase sanctions. All this doesn’t sound like a good economic combination. Precious metals continue to be bid this morning and the Yen is playing a safe haven role. If this gets out of hand or escalates in any way, read below for the Yen Carry Trade unwind trade idea.
Conclusion
On balance we would say that institutional investors, especially in the West, have turned less bullish for Gold and some have turned outright bearish and given it is the marginal difference between supply and demand that sets the price, prices have suffered as former institutional demand has turned into supply as ETFs were sold. Having had a good run with Gold for many years, institutional investors may not return in a hurry, which could keep prices subdued and it also runs the risk of prompting more redemptions. That said, if demand for Gold ETFs did return, then buyers would no doubt have a real scramble on the hands to get hold of physical Gold again, a lot of which has been converted into small bars and jewellery that are likely to held in tight hands.
This begs the question what could spark up interest in Gold again and that is an easy one to answer – monetisation of Gold. If creditors of the developed world’s debt start to monetise Gold as they fear the fiat money their debt is denominated in is being debased, then Gold prices are likely to rise and then institutional investors are likely to want to get involved again. Overall we feel the issues facing the EU, China, Japan and the US are so big that policymakers will do whatever is necessary to avoid a meltdown. This has already been seen and it has provided investors with a degree of comfort on the lines of ‘too big to fail’ and as a result of that equity markets are hitting record highs. However, the leading developed countries’ debt and deficits are now so large that it is difficult to see how they will be settled without some form of currency debasement where creditors’ assets lose value and debt is reduced as the currency the debt is denominated in is devalued. Given the likelihood of this we expect Gold to become more monetised.
References
-
Irwin, D. A., (2011), Anticipting the great depression? Gustav Cassel´s analysis of the interwar gold standard, NBER Working Paper 17597, available at:
-
Meissner, C. M. (2013), Capital flows, credit booms, and financial crises in the classical gold standard era, NBER Working Paper 18814, available at:
-
MEISSNER, Christopher M. (2005): “New World Order: Explaining the International Diffusion of the Gold Standard, 1870-1913”, Journal of International Economics, 66, pp. 385-406.
-
Tripathi, Shruti, Understanding the Macroeconomic Effects of Oil Price Shocks: A DSGE Framework (March 28, 2014). Available at SSRN:http://ssrn.com/abstract=2417224 or http://dx.doi.org/10.2139/ssrn.2417224
-
Rosehart, William D. and Zareipour, Hamid, Energy Efficiency: Finding Leadership Opportunities (February 4, 2014). SPP Research Paper No. 7-3. Available at SSRN:http://ssrn.com/abstract=2390873
-
Moshiri, Saeed, The Effects of the Energy Price Reform on Households Consumption in Iran (September 30, 2013). USAEE Working Paper No. 13-142. Available at SSRN:http://ssrn.com/abstract=2333999 orhttp://dx.doi.org/10.2139/ssrn.2333999
-
Hamilton, J.D. (2009) ‘Understanding Crude Oil Prices.’ Energy Journal. 30(2) pp. 179-206.
-
Kaufmann, R.K. (2010) ‘The role of market fundamentals and speculation in recent price changes for crude oil’. Energy Policy. 39(1) pp. 105-115.
-
IMF, 2013. Energy Subsidy Reform: Lessons and Implications. Washington DC: International Monetary Fund.
-
ScottiaMocatta, Precious Metals 2014 Forecast Gold, Scotia Bank, November 2013
-
http://timesofindia.indiatimes.com/business/india-business/China-pips-India-in-gold-consumption/articleshow/30649901.cms
-
http://news.xinhuanet.com/english/china/2014-02/11/c_133106423.htm
-
Gold Demand Trends, full year of 2013, World Golf Council, published in February 2014, available at:< http://www.gold.org/supply-and-demand/gold-demand-trends˃
-
Lubbers, E., senior investment analyst and trader with a focus on commodities, energy and mining companies, available at:< http://goldresearcher.com/alternative-valuation/˃
-
Keith W., 2014, CEO, Monetary Metals Founder, Gold Standard Institute USA, available at:< http://www.kitco.com/ind/Weiner/2014-03-31-Monetary-Metals-Supply-and-Demand-Report-30-Mar-2014.html˃
-
Murphy, H., (2014), trader at Kitco Metals Inc., available at:< http://www.kitco.com/ind/Murphy/2014-04-25-The-Yen-Carry-Trade-Looks-Heavy-On-The-Back-Of-Ukraine-Russia.html˃
New insights into Debt Crisis
Table of Content
Introduction. 3
1 Consequences of Crisis. 3
2 The Casy study of Greece. 4
3 Economic Crises. 4
4 The synchronisation between EU stock market 6
5 SMP, LTROs, OMTs. 9
6 Self-fulling debt crises. 11
6.1 Debt intolerance, defaults, crisis. 12
Conclusion. 15
References. 15
Introduction
Particularly, when the government tries to reduce private debt, this results in an increase of public debt. So on the one hand the debt crisis has a significant impact on the Eurozone, as it constantly raises new issues as to its viability and on the other hand the future of the Euro as a common currency as described Blundell-Wingall, Slovic (2010, p.4).
1 Consequences of Crisis
The real consequences associated with the banking crisis (higher unemployment) describe in general, changes of the current account balance of whatever sign are not necessarily an indication of imbalances. Viewed in this light, they may simply reflect intertemporal saving as well as consumption and investment preferences of private enterprises, households and governments presented by Obstfeld and Rogoff (1994). Moreover, rising prices and unit labour costs and strong investment could be due to a catch-up of periphery countries within the euro area.
Candelon, Palm (2009, p.3) noticed it may affect government tax revenues, which will shrink, and on the other hand government spending, which will rise, through social security (unemployment benefits) and through measures designed to stimulate global demand. Nevertheless, this automatic stabilizer mechanism deepens the budget deficit and increases the debt. As a consequence, this restrictive fiscal policy could increase the probability of default for households, increasing the amount on non-performing loans, again putting tensions on the banks’ balance sheet.
Hofmann (2012, p. 2-3) pointed out that a country with unsustainable debt exercises emergency measures to regain sustainability. The goal of economic growth requires measures to increase a country’s competitiveness, that include austerity, default and restructuring, as well as inflation coupled with depreciation of the currency. On the other hand monetary depreciation caused by expansionary monetary policy, potentially coupled with Quantitative Easing, is the easiest way out. As a result, that may raise the country’s competitiveness through boosting exports and potentially attracting capital lured by cheap production cost. Viewed in this light, a country in a currency union lacks the power to control and enforce these measures. In sum, depreciation of the Euro is simply impossible without detrimentally affecting all of the 17 Euro zone countries that are intractably linked by the same currency.
2 The Casy study of Greece
Sakellaropoulos, T. D. (2012, p. 2-5) pointed out that Greece’s economic history during the 19th and 20th centuries shows that the development model followed was a capitalist modernization “pushed” from abroad and characterized by slow progress, an economy characterized by a weak industrial base, the long existence of agricultural structures and institutional backwardness.
Moreover, in the sense of the spill-over of growth and the expansion of enterprises to the South, the expansion of the import-export sector and foreign trade imbalances as well as the increase of international public borrowing and debt, international division of labor has made Greece extremely vulnerable to international fluctuations and turmoils, especially in relation to the monetary/ exchange rate and fiscal sector.
3 Economic Crises
Nevertheless, the real economic crises are either crises of underproduction (that is crises of the old type 1830-1857) or crises related to the overproduction of basic agricultural products in the framework of the prevalent model of monoculture farming and monoexport (e.g. raisins in the 19th century, tobacco crop and cotton in the 20th century). In the latter cases the crises were due to the sudden fall in the international demand (raisin crisis of 1893, tobacco crisis of 1930). An industrial crisis of overproduction leading to a significant de-industrialization took place as late as 1970 and the depression that started with the oil crises of 1973 and 1979. The result of this crisis was a process of deindustrialization that in a period of 10 years resulted in the closing down of almost half of the Greek industry.
The crisis took nonetheless the form of a fiscal and debt crisis.The debate on and the search for the appropriate remedies for the debt crisis and the euro-zone crisis in the framework of globalization, EU, and the need to remain part of the euro-zone needs to take into consideration one basic finding in relation to the real causes of the global crisis which started with Lehman Brothers Bankruptcy in 2008.
In other words, globalization –starting in 1989- has resulted in an unprecedented unification of financial markets at global level. At the same time, this has not been coupled with supranational regulatory mechanisms that would protect the global and national economies from monetary and exchange rate crises created by the power of limited but powerful financial centers.
Viewed in this light, prospect we demand once more the adoption of common European economic, fiscal and social rules as an effective barrier to the uneven growth of the Eurozone. Those opposing such strategy are those of neoliberal aspirations or those advocating economic nationalism.
Pappas, V., Ingham, H., Izzeldin, M., Steele, G. R. (2013, p. 2) presented that financial markets, retail markets and labour markets were integrating at different speeds. In the broadest macroeconomic context, the Eurozone still had to come to terms with the inconsistent trinity. Where there is a single currency only two of three are possible: a) fixed exchange rate; b) free capital movement; c) independent monetary policy. While constituent nations could not monetize their sovereign debt, they could borrow money at much lower interest rates than (for some) their fundamentals would suggest. For Greece, borrowing financed consumption rather than the investment that might have raised international competitiveness.
However, financial crisis struck, particular stresses within the Eurozone derived from: a) overly cheap credit; b) the bursting of a generalized property bubble; and c) huge variation in productive efficiencies and, therefore, competitiveness across the Eurozone.
As weak economic fundamentals in one nation are brought into the spotlight by a crisis, investors may fear that other nations have similar traits. The reaction can then set contagion in train (Masson 1999). For example, towards end-2009, when problems in Greece were traced to chronic fiscal/debt problems, the fear grew of similar pressures in Italy and Portugal.
4 The synchronisation between EU stock market
Gómez-Puig, M., Sosvilla R., Simón, C. (2014, p. 6-10) examined the synchronisation between EU stock market indices during the recent financial crisis, they used a DCC-GARCH with a Markov-Switching model. The models allow for the time variation in correlation dependencies among the nations, as well as for the endogenous estimation of the crisis transition date.
Their measures are devised for the duration and intensity of the crisis, and for correlation change between precrisis and crisis periods. More specifically, duration and intensity measures build on the fact that all nations neither ‘enter’ nor ‘exit’ the crisis regime at the same time. Dynamic correlation change measures indicate that sub-regions within EU reveal varying contagion patterns. These measures allow us to assess the synchronisation patterns of the financial crisis and to distinguish between regional and sub-regional contagion.
They confirm financial contagion in five of the six nation groups. Not all of Europe’s markets are hit by the crisis at the same time. In particular, the Core EU group is the first to be affected, with the Baltics lagging by one year. On average the nations of the EU-15 are affected earlier than the NMS, with the latter exhibiting a lag of over five months. This gives confirmation to the idea of a varying EU financial integration process. Even within EU-15, however, there are notable exceptions, most notably those of Luxembourg and Greece. Their experience of the crisis comes, respectively, five months earlier/later than their EU-15 counterparts. Nations which were forerunners in the accession talks were also affected relatively earlier.
Again, in the broadest terms, EU-15 was affected most heavily, with Luxembourg and Greece the worst hit. For Luxembourg this may be attributed to the reliance on finance, particularly hedge funds. For Greece, the lack of competitiveness and chronic sovereign debt problems are well-documented. The PIIGS group was the most severely affected; the RAMS II group was the least severely affected. In general, both the degree of industrialisation and market concerns over the financing of sovereign debt are relevant to the intensity of any financial crisis. The distinction between regional and sub-regional contagion is of interest. There are some instances where stock markets become more aligned during a crisis (regional contagion); (i.e., Scandinavian, PIIGS), and others where the greater alignment of stock markets occurs only for nations that share similar (trade and development) characteristics (sub-regional contagion); (i.e., Core EU).
In fact, not only did the period of financial turmoil turn into a global financial crisis, but it also began to spread to the real sector, with a rapid, synchronized deterioration in most major economies. This financial crisis put the spotlight on the macroeconomic and fiscal imbalances within European Economic and Monetary Union (EMU) countries which had largely been ignored during the period of stability when markets had seemed to underestimate the possibility that governments might default (see Beirne and Fratzscher, 2013).
Indeed, since 2010, Greece has been bailed out twice and Ireland, Portugal and Cyprus have also needed bailouts to stay afloat. These events brought to light the fact that the origin of sovereign debt crises in the euro area varies according to the country and reflects the strong interconnection between public and private debt (see Gómez-Puig and Sosvilla-Rivero, 2013).
Gómez-Puig, M., Sosvilla R., Simón, C. (2014) in their research paper: First, to tested for the existence of possible Granger-causal relationships between the evolution of the yield of bonds issued by both peripheral and central EMU countries, second, to determined endogenously the breakpoints in the evolution of those relationships and third, to detected contagion episodes according to an operative definition: an abnormal increase in the number or in the intensity of causal relationships compared with that of tranquil periods, triggered by an endogenously detected shock.
According to their results, we see around two thirds out of the total endogenously identified breakpoints occur after November 2009, when Papandreou’s government revealed that its finances were far worse than previous announcements, suggesting that most of the breakpoints can be explained by systemic shocks directly connected to the euro sovereign debt crisis. Second, the number of causal relationships increases as the financial and sovereign debt crisis unfolds in the euro area, and causality patterns after the break dates are more frequent when EMU peripheral countries are the triggers. Third, in the crisis period we find evidence of 101 causal relationships: 41 represent new causality linkages and 60 are patterns that already existed in the tranquil period. However, they found an intensification of the causal relationship in 42 out of the 60 cases.According to their opinion, these 41 new causality patterns, together with the intensification of the causal relationship in 70% of the cases can be considered an important operative measure of contagion that is consistent with the definition we have proposed.
As a result we what we mentioned above, we can say that regarding to policy implications, their results seem to indicate that EMU has brought about strong interlinkages of the participating countries which are reasonable within a group of countries that share an exchange rate agreement (a common currency in the case of the euro area) and where financial crises tend to be clustered. Therefore, they consider that their results might have some practical meaning for investors and policymakers, as well as some theoretical insights for academic scholars interested in the behaviour of EMU sovereign debt markets.
Casiraghi, M., Gaiotti, E., Rodano, M. L., Secchi, Al. (2013, p. 7) described that during the summer of 2011 sovereign debt market tensions resurfaced in some euro-area countries. The strains affected Italy directly and were rapidly transmitted to the banking sector and other segments of the domestic financial market. Corporate bond yields and money market spreads soared, interbank loans dried up, and stock indexes plummeted. The effects were amplified both by the abrupt interruption of capital flows among euro-area countries and by the sudden funding freeze faced by banks on international markets. In other words, the adverse impact on the cost and availability of credit to the private sector led to a sizeable drop in aggregate demand. In the summer of 2012 fears of a possible break-up of the euro area aggravated financial tensions and further increased the crosscountry disparities in monetary conditions.
In response the ECB took several unconventional measures. It reactivated the Securities Markets Programme (SMP) and extended it to Italian and Spanish government bonds in August 2011, it granted three-year loans to banks (3-year Longer-Term Refinancing Operations, LTROs) in December 2011 and in February 2012, and it announced the Outright Monetary Transactions (OMTs) in September. These instruments were designed to support market segments that were dysfunctional, foster bank liquidity, avert a credit crunch and dispel the fears of a euro-area breakup.
Their results suggest that the SMP, the 3-year LTROs and the OMTs have been effective in offsetting undue increases in government bond yields and easing money markets tensions, with a positive and significant impact on credit supply. Transmitted mainly through the credit channel, the policy measures induced a cumulative output growth response equal to 2.7 percentage points in 2012-2013. In considering these findings, one should bear in mind that a full counterfactual scenario is beyond the scope of this paper. The ECB’s unconventional policies may have avoided a generalised collapse of financial and credit markets, which cannot be studied using the standard econometric tools insofar as the effects would have been very large and highly non-linear.
Nevertheless, their analysis provides an estimate that may be interpreted as a lower bound of the overall macroeconomic impact of the unconventional monetary policy measures considered.
5 SMP, LTROs, OMTs
In order to estimate the impact of the non-standard measures adopted by the ECB in 2011 and 2012 (SMP, 3-year LTROs, OMTs) on the Italian economy, we first adopted specific estimation approaches to measure the impact on money market interest rates, government bond yields and credit availability and then mapped the estimated effects onto their macroeconomic implications, taking advantage of the Bank of Italy quarterly model of the Italian economy.
The first conclusion is that the SMP has been effective in contrasting undue increases in government bond yields. This conclusion is based on a set of regressions linking daily changes in bond yields with SMP purchases and a series of control variables. The estimates indicate that the effect of the SMP on Italian government bond yields is around 2 basis points per billion euros purchased.
Second, the LTROs had a significant impact on credit supply, mainly through a sizeable reduction in money market spreads, associated with the revival of the interbank market. Although bank lending continued to decrease in Italy in 2012, this result suggests that the unconventional operations may have avoided a much more severe credit restriction and helped to counteract the decline in lending to firms both in 2012 and 2013.
Third, the announcement and the design of the OMTs had very large frontloaded effects on the sovereign bond market. Yields on Italian government bonds decreased sharply after President Draghi’s speech at the end of July 2012, and the improvement was reinforced by the ECB Governing Council announcements in early August and September. From a macroeconomic perspective, our simulations indicate that the unconventional measures have had a powerful effect on the Italian economy through several channels. Based on the standard elasticities included in the BIQM, the cumulative GDP growth response comes to 2.7 percentage points over the period 2012-2013. One of the main channels of transmission is the improvement in credit availability, in particular through its impact on investment.
The simulations also show that the set of unconventional operations had a favourable effect on relevant macroeconomic variables that are usually not emphasised in discussions on the effectiveness of monetary policy. They found that the deficit-GDP ratio improves greatly thanks to the combination of lower interest expenses and higher growth. The flow of new impaired bank loans decreases, as lower interest rates and higher growth support businesses’ profits and cash flow. There accordingly appears to be good reason to believe that the unconventional policies helped avoid a further worsening of the adverse spiral between sovereigns, banks and growth.
All in all, while the Securities Markets Programme, the 3-year Longer-Term Refinancing Operations and the Outright Monetary Transactions did not prevent the Italian economy from falling into recession, they did keep it out of a much deeper depression. Even so, interest rates did not completely regain their pre-crisis levels, credit conditions remained relatively tight, and business lending continued to contract, although less sharply than would otherwise have been the case. These findings support the thesis that some of the underlying causes of the sovereign debt crisis could not be addressed and solved by monetary policy alone. Nevertheless, our results provide powerful evidence for the argument that the unconventional monetary measures supported economic activity by avoiding a further downward spiral of the crisis of confidence and a much more severe credit crunch.
6 Self-fulling debt crises
Aguiar, M., Amador, M., Farhi, E., Gopinath, G., (2013, p. 3) presented model that highlights the fact that partial default via inflation versus explicit default may have asymmetric costs, and the key comparative static is in regard to the relative costs of inflation. Viewed in this light, a useful feature of separating the costs of full default from those of inflation is that a country can credibly commit not to partially default through inflation by issuing bonds in foreign currency; a similar commitment technology for explicit default is not as readily available. They therefore address in their research paper that the positive and normative implications of issuing domestic versus foreign currency bonds in an environment of limited commitment, and how this tradeo varies with the level of inflation commitment when the government issues domestic-currency bonds.
What does it mean? In equilibrium, risk-neutral foreign investors purchase sovereign bonds at prices that reflect anticipated government decisions to repay, default, or inflate. In turn, the government’s optimal policy depends on the equilibrium interest rate, raising the possibility of self-fulling debt crises. According their results, environment allows us to explore how the degree of inflation credibility alters the country’s vulnerability to self-ful.
In turn, the government’s optimal policy depends on the equilibrium interest rate, raising the possibility of self-fulling debt crises. According their results, environment allows us to explore how the degree of inflation credibility alters the country’s vulnerability to self-fulling debt crises. A main finding of their analysis is that inflation credibility and by implication the choice of domestic versus foreign currency bonds has an ambiguous impact on the possibility of a self-fulling debt crises and on welfare.
6.1 Debt intolerance, defaults, crisis
Reinhart, C. M., Rogoff, K. S., (2010, p. 3) presented in their paper following factors of defaults and banking crisis. First, private debt surges—fueled by both domestic banking credit growth and external borrowing are a recurring antecedent to domestic banking crises; governments quite often contribute to this stage of the borrowing boom. (Banking crises in financial centers have also historically helped predict domestic banking crises elsewhere). Second, banking crises (domestic ones and those in international financial centers) often precede or accompany sovereign debt crises. Third, public borrowing accelerates markedly and systematically ahead of a sovereign debt crisis (be it outright default or restructuring); the government often has “hidden debts” that far exceed the better documented levels of external debt. These hidden debts include domestic public debt (which prior to our data were largely undocumented) and private debt that become public (and “publicly” known) as the crisis unfolds. Quantifying public contingent liabilities is beyond the scope of this paper. A fourth related hypothesis (which we document but do not test) is that during the final stages of the private and public borrowing frenzy on the eve of banking and debt crises and (most notoriously) bursts of hyperinflation, the composition of debt shifts distinctly toward short-term maturities.
Debt intolerance described by Reinhart, C. M., Rogoff, K. S., (2010, p. 11) manifests itself in the extreme duress many emerging markets experience at debt levels that would seem quite manageable by advanced country standards. “Safe” debt thresholds for highly debt intolerant emerging markets turn out to be surprisingly low, perhaps as low as fifteen to twenty percent in many cases, and these thresholds depend heavily on a country’s record of default and inflation. However, debt intolerance likely owes to weak institutional structures and a problematic political system that makes external borrowing a useful device for developing country governments to avoid hard decisions about spending and taxing and global investors rightly suspicious about the government’s motives. Simply put, the upper limit to market access is lower when governments suffer from an intolerance to repayment but not to borrowing.
Al-Saffar, Y., Ridinger, W., and Whitaker, S., (2013, p. 17) described in their paper The role of external balance sheets in the financial crisis, that structural changes in the liquidity risk profiles of banks away from short-term funding mismatches and toward more stable, longer-term funding of assets and business activities, international regulators under Basle III intend to implement a Net Stable Funding Ratio (NFSR) requirement. This will require long-term assets to be funded with at least a minimum amount of stable liabilities. The results in their paper point to fragilities arising from funding long-term assets with short-term debt liabilities, particularly to other banks, consistent with the need for an NFSR. A similar point applies to the related Basle III Liquidity Coverage Ratio, which will require banks to maintain sufficient liquid assets to meet liquidity needs for a 30 calendar day time horizon under a significantly severe liquidity stress scenario specified by supervisors.
The finding that a country’s external bank balance sheet measured on a residency basis — including foreign banks — appears to contain more information about vulnerabilities than the consolidated balance sheets of banks headquartered in that country, reinforces the need for close co-operation between national banking supervisors. National supervisors need to be aware of significant cross-border activity carried out by resident foreign branches which are not within their supervisory control and need to consider the importance of resident foreign branches for financial stability. Indeed, that is why the Basel Concordat on cross-border banking supervision gives host authorities responsibility for the liquidity of resident foreign branches.
Calls for better monitoring of the risks inherent in national balance sheets and the removal of biases leading to over reliance on short-term debt were prominent in the aftermath of the EME crises of the 1990s, for example the Draghi Report (2000). More recently, the G30 report on ‘Long-term finance and economic growth’ and the Committee on International Economic Policy and Reform have called for policymakers to reduce incentives for short-term cross-border flows and for a reduction of biases in favour of debt over equity financing. The results of this paper are consistent with those recommendations about the structure of national balance sheets. But this paper does not consider the question of the optimal size of balance sheets or the costs and benefits of gross capital flows overall. In this regard, it is notable that large external equity liabilities were not associated with larger falls in GDP.
Conclusion
What we mentioned in this paper shows that macroeconomic national differences in the euro area and their solutions should be transferred only on the shoulders of national economies , but also the EU regulator and monetary authorities. It is necessary to think about their role and its implementation is essential for the recovery of the euro area. The main cause of the crisis in the euro area debt accumulated before the outbreak of the crisis and private debt . In other words, the massive expansion of debt in the euro area continued despite the outbreak of the financial crisis. Fiscal pact envisages that future governments if hit and will again bail the private sector will be punished and it all drawn further implications. However, this proves to be not sufficient and strategic solutions. Troubled euro states clearly faces significant internal pressure in the national economies in the context of pressure on competitiveness through social cuts and rising retirement age.
References
-
Aguiar, M., Amador, M., Farhi, E., Gopinath, G., (2013) Crisis and commitment: Inflation credibility and the vulnerability to sovereign debt crisis, Working Paper 19516, National Bureau of Economic Research, http://www.nber.org/papers/w19516
-
Al-Saffar, Y., Ridinger, W., and Whitaker, S., (2013), The role of external balance sheets in the financial crisis, Financial Stability Paper No. 24 – October 2013, Bank of England, ISSN 1754–4262
-
Beirne, J. & Fratzscher, M. (2013). The pricing of sovereign risk and contagion during the European sovereign debt crisis. Journal of International Money and Finance, 34, 60-82.
-
Blundell-Wingall, A., Slovic, P. (2010) “The EU Stress Test and Sovereign Debt Exposures.” OECD Working Papers on Finance, Insurance and Private Pensions, p. 4
-
Candelon, B., Palm F.C. (2010) „Banking and Debt Crises in Europe: The Dangerous Liaisons?“, CESifo working paper Fiscal Policy, Macroeconomics and Growth, 3001, available at: http://hdl.handle.net/10419/38910
-
Casiraghi, Marco and Gaiotti, Eugenio and Rodano, Maria Lisa and Secchi, Alessandro, The Impact of Unconventional Monetary Policy on the Italian Economy During the Sovereign Debt Crisis (September 27, 2013). Bank of Italy Occasional Paper No. 203. Available at SSRN: http://ssrn.com/abstract=2405451 or http://dx.doi.org/10.2139/ssrn.2405451
-
Gómez-Puig, Marta and Sosvilla Rivero, Simón, Causality and Contagion in EMU Sovereign Debt Markets (February 3, 2014). Research Institute of Applied Economics Working Paper 2014/03. Available at SSRN: http://ssrn.com/abstract=2405929 or http://dx.doi.org/10.2139/ssrn.2405929
-
Hofmann, Ch. (August 1, 2012) „The Euro Zone Crisis“, available at SSRN: <http://ssrn.com/abstract=2121499>
-
Masson, P. (1999) ‘Contagion: macroeconomic models with multiple equilibria’, Journal of International Money and Finance, 18(4), 587-602.
-
Pappas, Vasileios and Ingham, Hilary and Izzeldin, Marwan and Steele, G R, Financial Markets Synchronization and Contagion: Evidence from CEE and Eurozone (October 1, 2013). Available at SSRN: http://ssrn.com/abstract=2411978 or http://dx.doi.org/10.2139/ssrn.2411978
-
Reinhart, C. M., Rogoff, K. S., (2010), From financial crash to debt crisis, Working Paper 15795, http://www.nber.org/papers/w15795, National Bureau of Economic Research
-
Sakellaropoulos, Theodoros D., Debt Crisis and the Welfare State in Greece (2012). Global Dialogue, 2012. Available at SSRN: http://ssrn.com/abstract=2424081
New insights into Offshore Financial Centers

Table of Content
1 What are Offsshore Centres?. 3
1.1 Offshore Corporate Governance in Practice. 3
1.2 Ownership of Voting Shares. 4
3.1 Do OFCs make bad neighbors?. 6
3.2 Offshore bond issuance decision. 6
5 What includes offshoring?. 11
6 Offshore Centres in Slovakia.. 15
Introduction
In recent years, outsourcing of broader ranges of tasks by a larger number of firms has spread across the national boundary. Although the decision of offshore outsourcing by heterogeneous firms has become one of the hottest research topics in international economics, empirical studies have been constrained by the limited availability of micro-data. The increasing offshore R&D activities performed by multinational companies have also attracted the interest of international and industrial economists.
1 What are Offsshore Centres?
The IMF defines Offshore centers (OFC)s as follows: (i) Jurisdictions that have relatively large numbers of financial institutions engaged primarily in business with non-residents; and (ii) jurisdictions with financial systems with external assets and liabilities out of proportion to domestic financial intermediation designed to finance domestic economies; and (iii) centers which provide some or all of the following services: low or zero taxation; moderate or light financial regulation; banking secrecy and anonymity.
The number of offshoring firms (the extensive margin) and the real value added per offshoring firm (the intensive margin) fluctuate over the business cycle, and thus affect output, prices and wages in both the parent and the host countries.
However, Corruption money laundering in offshore financial centers is further connected with another largely unexplored phenomenon in the world economy – round-trip investment, i.e. the transfer of funds abroad in order to bring some or all of the investment back to home country as foreign investment.
1.1 Offshore Corporate Governance in Practice
Under English or Swiss law – the leading hedge fund centers which we shall use by way of example – it is important that any offshore company has its central management and control in its jurisdiction of incorporation, or that this is at least not carried out from the UK or Switzerland. In other words, central management and control refers to the board of directors or management committee of the company according to the information from report of Laven Financial Services (2013, p. 3-4). Laven Financial Services offers corporate governance, international compliance and operational support services, as well as directorships to offshore management companies.
1.2 Ownership of Voting Shares
According to the Laven F. S. depending on the general structure, the (voting) shares of an offshore management company are often held by another offshore company or trust, or an individual shareholder who is usually offshore domiciled. Onshore directors and persons may hold voting shares but this should be avoided as it will be deemed to add to the control that is exercised onshore.
Viewed in this light, with regard to the UK , as of 1 January 2013, new rules on Controlled Foreign Companies were introduced which brought about the need for any UK businesses with overseas subsidiaries to understand the relevant legislation as it may now have a direct fiscal impact on the group overall. In short, the rules on Controlled Foreign Companies determine whether a non-UK company is controlled by a UK person/company (whether by virtue of legal, economic or accounting control) and therefore a charge should be applied on its profits.. Irrespective of this new law, for many UK based managers it is still common for UK resident directors to hold controlling interests in offshore companies that are linked to asset management responsibilities. This is probably very likely to lead to the UK tax authority to re-qualify the domicile of the offshore companies. In practice, this happens especially if all the other considerations demonstrate control from the onshore jurisdiction.
2 Transfer Pricing
Moreover, well controlled and exercised corporate governance should also include an assessment of transfer pricing, where relevant. Offshore businesses (e.g. offshore management companies) and onshore service providers (e.g. onshore sub-managers) that are connected parties (for example due to links of ownership and/or common management) will need to consider issues which relate to the value of the services provided from onshore to offshore.
More to the point, a documented assessment should be carried out for the purpose of determining a fair price for the services and in support of the transactions between the parties. This process should establish an understanding of what is market practice for similar services and to limit therefore any potential for queries by tax authorities in relation to the transactions.
In terms of recent developments, the Alternative Investment Fund Managers Directive (AIFMD) entered into force on 22 July 2013 and introduced the Letter-Box Entity provisions which are relevant, for example, to structures where an offshore manager delegates certain activities to an onshore sub-manager. Where an offshore manager is deemed a letter-box entity, it can no longer be considered as the manager of the fund in question and would therefore not be compliant with the AIFMD described by Laven F. S. (2013).
As a corporation, or body corporate, a private company is regarded in law as having a separate legal personality from its shareholders (owners) and directors (managers) (Courtney 2002). Such a legal entity may have been incorporated through a registration process established through legislation. Hence, an offshore firm is a legal entity which has registered its headquarters or subsidiary through the laws of an OFC. In his paper, he defines two types of offshore firms: Type I, which have headquarters registered in OFCs, while Type II firms have set up subsidiaries in an OFC (or in multiple OFCs) but have headquarters registered in 15 countries with the strictest legal regimes based on La Porta et al. (1998) (Austria, Australia, Belgium, Canada, Denmark, Finland, France, Germany, the United Kingdom, Japan, Netherlands, New Zealand, Norway, Sweden and the United States). Not all Type I offshore firms keep their headquarters in OFCs. About 53% of Type I offshore firms have headquarters registered and keep their headquarters in OFCs. The rest (47%) of Type I offshore firms have their headquarters in other countries or jurisdictions. After we control for the impact of OFC-registered and headquartered via OFC-registered but not headquartered of Type I offshore firms on financial reporting quality, the results are similar irrespective of the locations of offshore firms’ headquarters.
3 Offshore Growth
If we look at the anonymity of the offshore centres, world makes it difficult to track the flow of money. A study by James S. Henry, former chief economist at McKinsey & Company, estimates that wealthy individuals have $21 trillion to $32 trillion in 2013 in private financial wealth tucked away in offshore havens — roughly equivalent to the size of the U.S. and Japanese economies combined.
Even as the world economy has stumbled, the offshore world has continued to grow, said Henry, who is a board member of the Tax Justice Network, an international research and advocacy group that is critical of offshore havens. His research shows, for example, that assets managed by the world’s 50 largest “private banks” — which often use offshore havens to serve their “high net worth” customers — grew from $5.4 trillion in 2005 to more than $12 trillion in 2013.
3.1 Do OFCs make bad neighbors?
One might expect proximity to an OFC to be bad for the neighborhood, since OFCs encourage tax evasion and other illegal activities. However, the presence of nearby offshore financial centers may also have beneficial effects. Most importantly, the presence of an OFC with an efficient financial sector may increase the competitiveness of a source country’s banking sector, though this benefit is tempered by transactions costs.
3.2 Offshore bond issuance decision
The decision to issue in foreign currency or abroad is often affected by the desire to widen the investor base to include foreign investors. Thus the extent to which domestic markets are open to foreign investment is a critical factor in the domestic vs. offshore bond issuance decision. That withholding taxes are often a significant deterrent to investing in local markets for foreign investors, and thus can hinder the depth and liquidity of those markets, has been greatly emphasized by market participants in Asia (see Chan et al. (2011)). Similarly, the same report identifies restrictions on foreign investors investing in domestic bonds as a further area for market development. Where countries impede cross-border investment, they will enhance the offshore market. These factors are relevant to the static trade-off and the risk management theories as well as the market depth hypothesis, therefore we consider how the tax incentives for foreign investors affect the depth of the market, and its development. Chan et al. (2011) document that countries in Asia have varied the application of withholding taxes over time, and this potentially has an influence on the attractiveness of local currency bonds to foreign investors.
The third measure by Mizen, P., Packer, F., Remolona, E., Tsoukasp, S. (2012, p. 11) use to indicate market development is the scale of the derivatives market. The development of FX markets and derivatives in EMEs usually depends on the depth and liquidity of local debt markets as a proxy measure for the ability to swap easily in and out of the domestic and other currencies and has also been used as a market specific factor that might determine the extent of bond issuance. To the extent that firms can transform their interest payments on foreign (or domestic) bond issues into synthetic domestic (foreign) payments that can be serviced by domestic (foreign) cash flows, better developed swaps and derivatives markets could in principal enhance the growth of both foreign currency and domestic currency bond issues.
They combined these market-level data with firm-level data in an unbalanced panel for the eight countries (China, Hong Kong SAR, Indonesia, Korea, Malaysia, the Philippines, Singapore and Thailand) covering the period 1995 to 2007. They control for variables representing agency, static trade-off and risk management theories of the capital structure.
The question is: What difference have such reforms made to the actual financing decisions of firms in the region? Answers provided by Mizen, P., Packer, F., Remolona, E., Tsoukasp, S.(2012, p. 33-34) show that for many such borrowers, deep and liquid offshore markets have long provided financing for debt denominated in US dollars or euros. How do firms decide between offshore and onshore markets? Has the emergence of access to two parallel corporate bond markets changed the capital structure decision? More generally, do the observed choices between local and foreign currency shed light on the various theories of capital structure, including costly monitoring and agency theories, pecking order, market depth and risk management theories?
Their results provide the strongest support for the market depth hypothesis, i.e. the hypothesis that the choice of market will be determined to a large extent by the ability of the scale and depth of the market in question to accommodate borrower demands. Measures of domestic market scale and (relative) liquidity have a positive and highly significant impact on overall issuance, while measures which proxy for the probability of issuers overstretching local currency lending markets, such as firm size, leverage and long-term debt ratio, increase the likelihood of going offshore. The market depth hypothesis was also supported by the importance of the existence of a larger foreign investor base as well as the exemption of withholding taxes for non-resident investors. Issuers from countries with a large foreign investment presence are more likely to issue bonds, and more likely to do so onshore. Once the depth of the market was increased via withholding tax exemptions for non-residents, corporations were more likely to issue onshore as well.
Confirmation of the risk management theory – i.e. the hypothesis that firms that are more able to control the exchange rate risks should be more likely to issue offshore in a foreign currency – was evident based on tests utilizing data from a recently updated central bank survey on derivatives markets in different currencies. The size of currency hedging markets in each country – including FX swaps, currency swaps and options markets and other instruments covered by the BIS Triennial Survey – clearly increases the probability of issuance in foreign currency.
However, beyond investors and securities regulators, offshore firms’ financial reporting practices also preoccupy many government and public officials. From a public policy perspective, the opaque and poor financial reporting of many offshore firms has enabled them and their managers to evade paying taxes and to loot money from investors presented by Durnev, A., Li, T., Magnan, M., (p.3).
Therefore, we expect offshore firms to exhibit low quality financial reporting since managers have greater incentives to manage earnings in ways that mask diversion activities or hide poor performance (Kim et al. 2010).
Durnev, A., Li, T., Magnan, M., (2013, p. 5) describes that consistent with both the agency theory of tax avoidance and the quality of the legal environment, we find that offshore firms exhibit lower quality financial reporting through higher accruals management, lower accruals quality and less earnings persistence than non-offshore firms. Moreover, firms that have their headquarters registered in OFCs engage in more real earnings activities than non-offshore firms. In contrast, firms with OFC subsidiaries have less real earning activities than non-offshore firms.
If we focus on, The Offshore Attitude Index, definition is as follows – a comprehensive code of taxation, legal regimes, potential national benefits, political stability, and economic crime pollution for OFCs (Masciandaro 2008). Higher values of the Offshore Attitude Index for an OFC indicate more OFC-orientation (i.e., lower taxation, less potential national benefits and more flexible financial regulations).
4 Cost of outsourcing
There are costs to services outsourcing, and these costs are familiar from the literature on how trade in goods affects labor markets. While trade provides benefits for the nation as a whole, some people face dislocation. For example, workers with low skills within certain occupations such as data entry and low-end computer programming appear to have been affected by increased trade in services. The appropriate policy response is to help affected workers adjust to change rather than give up the gains from trade in the first place. Policies aimed at preventing trade, including outsourcing, would mean lower standards of living for both Americans and the citizens of developing countries.
Durnev, A., Li, T., Magnan, M., (2013) in their paper used a sample that includes firms that have their headquarters registered in 18 OFCs, firms that establish subsidiaries in OFCs but their headquarters are registered in 15 non-OFC countries with the strictest legal regimes, and firms without OFC operations from 37 non-OFCs. According their results, evidence shows that offshore firms engage in more accrual-based management, exhibit lower accruals quality and less earnings persistence than non-offshore firms. Firms that have headquarters registered in OFCs with a higher Offshore Attitude Index prefer accruals to increase their reported earnings but use real earnings activities as a supplement. Finally, using a U.S. sub-sample we distinguish that U.S. multinational firms with OFC subsidiaries exhibit poorer financial reporting quality compared to not only U.S. multinationals with non-OFC subsidiaries but also to U.S. domestic firms.
Zlate, A., (2010, p. 37) examines the effect of offshoring on the cross-country transmission of business cycles, while focusing on its extensive and intensive margins as separate transmission mechanisms. His paper considers a model of offshoring with heterogeneous .rms that is consistent with the empirical patterns of offshoring from U.S. manufacturing to Mexico´s maquiladora sector. First, following an aggregate productivity increase in the country of origin (North), the value added per o¤shoring firm jumps on impact and then returns to its initial steady state. However, domestic firm entry causes a gradual increase in the relative cost of fefective labor (i.e. the wage adjusted by aggregate productivity), which in turn generates a gradual increase in the number of offshoring .rms (the extensive margin), as in the data. Second, offshoring enhances the cross-country co-movement of output relative to the model with endogenous exports. The result is consistent with the empirical regularity documented in Burstein, Kurz, and Tesar (2009) that country pairs with larger shares of offshoring-related trade in bilateral trade also exhibit larger correlations of manufacturing output. Third, offshoring reduces the appreciation of the real exchange rate that follows an aggregate productivity improvement in the parent country, and thus dampens the Harrod-Balassa-Samuelson effect that occurs in the framework with firm entry and endogenously traded varieties.
There are a number of possible extensions to the model considered in this paper. First, the framework is useful to analyze the impact of offshore production on employment in the parent and the host countries. Second, a possible extension with rich policy implications would involve the study of interactions between offshore production and labor migration in a united framework, in which both offshoring and labor mobility are driven by flluctuations in the relative wage across countries. Third, while his paper studies the flluctuations of offshoring over the business cycle, further research should address the long-run developments in offshore production and its implications for U.S. manufacturing.
5 What includes offshoring?
Offshoring refers to the process of sourcing and coordinating tasks and business functions across national borders. Offshoring may include both in-house (captive, or international in-sourcing) and outsourced activities, which are delivered by an external provider – that is from outside the boundaries of the firm. Outsourcing, in turn, may occur both domestically (onshore) and abroad (offshore). Further, offshoring refers to sourcing rather than sales activities, and it supports global or domestic rather than local operations. It is not primarily intended for entering a foreign market nor for supporting the company’s local activities. For example, setting up HR (human resources) departments in foreign subsidiaries in support of local operations (e.g. sales and distribution) is not what we mean by offshoring. Only if HR services (e.g. payroll services) are provided from offshore in support of global or home-based HR functions, does the term ‘offshoring’ apply. Though it used to be limited to simple codified and repetitive tasks, companies are now offshoring increasingly complex and advanced activities requiring more and more qualified workers (Lewin and Peeters, 2006).
Lewin, A., Y., Massini, S., Peeters, C., (2008, p. 30-31) their empirical study reported in this paper brought together arguments of managerial intentionality, path dependence, and environmental effects to explain firms’ decision to offshore product development work. The results confirm that access to qualified personnel offshore is a strong determinant of such decisions, partly driven by a reduction in the supply of science and engineering talent in the US. The idea of cumulative experience building is also validated, although managerial intentionality seems to be a stronger determinant of PD offshoring decisions than firms’ past experience with offshoring. Among the strategic objectives that may lead firms to offshore, speed to market is a key factor underlying decisions to offshore portions of their innovation process. Conversely, firms with growth objectives are less likely to offshore PD. Finally, the study offers a clarification of the role of cost savings in explaining innovation offshoring. Firms do see PD offshoring as a unique opportunity to reduce the cost of their innovation activities partly through HBR strategies with labor arbitrage becoming a secondary driver. For small companies, access to lower cost S&E talent globally enables them to augment their limited in-house R&D resources (HBA strategies).
Their paper contributes to the debate about growing shortage of technical talent and globalization of human capital, by providing empirical support to the argument of an impending global race for science and engineering talent triggered by events such as the 2003 cutback in the H1B visa quota from 195,000 to 65,000 visas annually and the diminishing interest in entering the S&E careers as indicated by the decline in the number of US nationals earning advanced degrees in S&E. However, competing for science and engineering talent is unlike seeking markets or production platforms through FDI. Talent is different from other assets because it is highly mobile and because of high obsolescence. Accessing and managing talent in globally dispersed locations requires new recruiting and retention strategies as well as new organizational forms for managing, sharing, and exploiting knowledge. Although this paper sheds light on a few important questions regarding the determinants of firms’ decision to offshore innovation activities, we wish to acknowledge some limitations and future extension of the present research. First, although this paper provides an analysis of the influence of three types of factors on companies’ decisions to offshore product development, it is likely that these factors do not impact firms’ decisions independently of one another.
Ito, B., Tomiura, E., Wakasugi, R., (2007, p. 21-23) presented in their paper factors as follows. Noticeably more firms are outsourcing offshore, compared with five years ago, but still only around one-fifth of the midor large-sized firms are active in financial operations. Production-related tasks outsourced within East Asia occupy the major share in financial operations, while service outsourcing remains limited. In more than one-third of financial operations cases, tasks are outsourced to own offshore affiliates within the boundary of multinational firm. These may indicate still serious obstacles for active outsourcing, especially of service tasks, beyond the neighboring low-cost countries, or at the same time, unsolicited ample opportunities of global sourcing ahead of many firms. They pointed out that with respect to offshore R&D, the number of firms conducting offshore R&D are not large and different across industries. Electrical machinery and electronics, chemical, transportation machinery and general machinery are the dominant industries. The function of offshore R&D is not independent from headquarter. Two thirds of offshore R&D are incorporated in R&D at headquarter. The access to local market and the agglomeration of local firms and R&D institutions are major motivations of offshore R&D. We observe the high ratio of support-oriented R&D in every region as well as the high ratio of R&D collaboration in the U.S., EU and China. Most R&D are purposed to conduct the development, but one fifth is for conducting basic research in the U.S., EU and China. IPR protection is indispensable factor to determine the magnitude of offshore outsourcing and R&D. This survey presents how each firm perceives the protection of IPR in each country. The heterogeneous enforcement of IPR based on firm’s perception is useful to analyze how the corporate decision of offshoring is affected by the enforcement of IPR.
Paper of Ledyaeva, S., Karhunen, P., Whalley, J., (2013, p. 25-26) sheds light on a virtually unexplored phenomenon: round-trip investment from Russia to offshore financial centers and back to Russia. In particulart their empirically study the link between corruption and round-trip investment. Their empirical test is based on the firm-level data on foreign-owned firms in Russia obtained from Rosstat. Their main results can be summarized as follows.
First, they found quite robust evidence that round-trip investors tend to invest into more corrupt Russian regions than genuine foreign investors. Their result gives support for the proposition of laundering the proceeds of corruption via round-trip investment (in particular it’s high significance for the combined financial and real estate sector). It further indicates that round-trip investors may indeed be better equipped to cope with institutional deficiencies, e.g., corruption (in particular, the result`s significance in manufacturing sector). Second, they found evidence that round-trip investors invest more into regions with higher resource potential compared to their genuine foreign counterparts. Their finding indicates that round-trip investors are better able to exploit the business opportunities provided by the Russian natural resources than genuine foreign investors. This often requires allying with authorities, which is obviously easier for round-trip investors than for genuinely foreign investors. Furthermore, round-trip investors might be themselves the representatives of the authorities who already have access to resources. Finally, their results enable us to suggest that round-trip investors favor the development of the Dutch disease in Russia. In particular they are very highly concentrated in the service sector (real estate and financial activities, in particular), seem to aim at exploiting natural resources in Russia, tend to establish manufacturing firms in resource-based industries and support the development of corruption in Russia by investing into corrupt Russian regions. On the contrary, genuine foreign investments seem to work against the Dutch disease as they are more concentrated in manufacturing industries and regions with higher educational potential of population but are not tied to resource abundant and corrupt Russian regions.
Rose, A. K., Spiegel, M. M., examined (2006, p. 22) both the determinants of offshore financial centers and the consequences of OFCs for their neighbors. Using both bilateral and multilateral samples, we find empirically that successful offshore financial centers encourage bad behavior in source countries, since they facilitate tax evasion and money laundering. At first blush, it thus appears that OFCs are best characterized as “parasites,” since their attraction stems in part from allowing their source-country clients to engage in activities detrimental to the well-being of their homes.
Nevertheless, offshore financial centers created to facilitate undesirable activities can still have unintended positive consequences. In particular, the presence of OFCs enhances the competitiveness of the local banking sector. Using a model of a domestic monopoly bank facing a competitive fringe of OFCs, we demonstrate that OFC proximity enhances the competitive behavior of the monopoly bank and may increase overall welfare. This is true despite the fact that deadweight losses are borne when funds are transferred offshore to an OFC. They test these predictions using a multilateral data set, and show that proximity to an OFC is indeed associated with a more competitive domestic banking sector, and greater financial intermediation. They tentatively conclude that OFCs are better characterized as “symbionts.”
6 Offshore Centres in Slovakia
The largest absolute increase in 2013 reached the United States (99 new firms in OFC), Seychelles (40) and Panama (32). From a relative perspective was interesting countries such as Bahamas (+114%), Cayman Islands (+100%) and Panama (+ 52%). But it still decreases the number of firms with owners from Luxembourg (-38) and Cyprus (-12). “Unlike the Czechs, our entrepreneurs from Cyprus leave. They are affected by the crisis and unstable situation. Since the Luxembourg decided to alleviate its rules on banking secrecy and not to put more on the people who want to save on taxes for our business ceased to be attractive, “says current statistics Seliak Milan.
Conclusion
To a large extent, the issue of offshore outsourcing involves the same fundamental questions addressed by economists for more than two centuries concerning the impact of international influences on the domestic economy. To be sure, the world is different, as advances in technology have made it possible to trade a wider range of services. Services offshoring, however, fits comfortably within the intellectual framework of comparative advantage built on the insights of Adam Smith and David Ricardo. This is contrary to the assertions of some non-economists, who see a new paradigm created by improved technology and communications that somehow undermines the case for free trade.
References
- Burstein, A., C. Kurz and L. Tesar. 2009. “International Trade, Production Sharing and the Transmission of Business Cycles.” Journal of Monetary Economics, 55(4): 775-795.
- Courtney, T. B. 2002. The Law of Private Companies (2nd Edition). Bloomsbury Professional. 4.001
- Durnev, Art and Li, TieMei and Magnan, Michel, Beyond Tax Avoidance: Offshore Firms’ Institutional Environment and Financial Reporting (September 2013). CAAA Annual Conference 2009 Paper; AFA 2011 Denver Meetings Paper. Available at SSRN: http://ssrn.com/abstract=1325895 or http://dx.doi.org/10.2139/ssrn.1325895
- How to Run Offshore Management Companies and Funds with Substance and Corporate Governance, (August 2013), report from Laven Financial Services
- Chan, E., Chui, M., Packer, F. and Remolona, E.: 2011, Local currency bond markets and the Asian Bond Fund 2 initiative, BIS Paper 63, Bank for International Settlements.
- International Monetary Fund. 2008. Offshore Financial Centers: A Report on the Assessment Program and Proposal for Integration with the Financial Sector Assessment Program.
- Ito, B., Tomiura, E., Wakasugi, R., (2007) Dissecting Offshore Outsourcing and R&D: A Survey of Japanese Manufacturing Firms, The Research Institute of Economy, Trade and Industry, RIETI Discussion Paper Series 07-E-060, available at:
- Kim, J-B, Y. Li, and L. Zhang. 2010. Corporate Tax Avoidance and Stock Price Crash Risk: Firm-level Analysis. Journal of Financial Economics 100: 639‒
- Ledyaeva, S., Karhunen, P., Whalley, J., (2013), Offshore jurisdictions (including Cyprus), corruption Money laundering and russian round-trip investment, NBER Working Paper 19019, available at:
- Lewin, A., Y., Massini, S., Peeters, C., (2008) Why Are Companies Offshoring Innovation? The Emerging Global Race for Talent, available at: <http://www.bis.org/publ/work403.pdf˃
- Lewin, A.Y., & Peeters, C., 2006a. The Top-Line Allure of Off-shoring, Harvard Business Review, March: 22-24.
- Mizen, P., Packer, F., Remolona, E., Tsoukasp, S., (2012), Why do firms issue abroad? Lessons from onshore and offshore corporate bond finance in Asian emerging markets, BIS Working Papers, No 401, Monetary and Economic Department, available at:<http://www.bis.org/publ/work401.pdf˃
- Rose, A. K., Spiegel, M. M., (2006), Offshore financial centers parasites or symbionts?, NBER Working Paper 12044, available at: <http://www.nber.org/papers/w12044˃
- Zlate, A. Offshore Production and Business Cycle Dynamics with Heterogeneous Firms, (2010), Board of Governors of the Federal Reserve System International Finance Discussion Papers, Number 995
Value of Gold

Cena zlata = a lot of articles has not been published since NO editor didn´t make job offer suitable for me.
Geopolitická a svetová ekonomická štruktúra prechádza zmenou, z čoho vyplýva, že investičné výhľady sú viac nepredvídateľné, ako je obvyklé. Z daného dôvodu investičné portfóliá by mali zahŕňať reálne aktíva, ako sú komodity pre ochranu pred potencionálnym poklesom na finančných trhoch s cennými papiermi.
Čo je zlato? Krátku definíciu objasnenú Lubbersom, E., kde zdôraznil, že zlato je považované za finančné aktívum, nie priemyselnú komoditu, ako ropa či meď. Z toho vyplýva, že väčšina fyzického dopytu o zlato je úzko spojená s investíciami ako sú zlaté šperky, mince a pod. V tomto svetle, je badateľný nárast v podobe ponuky zo strany centrálnych bánk, najmä na rozvíjajúcich sa trhoch, ktoré hľadajú spôsoby ako diverzifikovať ich spoločnosti, ktoré uskutočňujú transakcie v cudzích menách. Na druhej strane, malé množstvo zlata sa používa v priemyselných odvetviach, predovšetkým v kvalitných medicínskych zariadeniach či v leteckom priemysle. Taktiež je potrebné dodať, že nepatrné množstvo zlata sa využíva aj ako náhrada chýbajúceho zuba, čo vedie k skrášleniu úsmevu.
Zlatý štandard
Je potrebné uviesť, že Veľká hospodárska kríza, zdôraznila zlatý štandard. Kniha vydaná Barrym Eichengreenom v 1992 prezentovala, že zlatý štandard bol kľúčovým faktorom, ktorý ovplyvnil hospodársku krízu po celom svete. Dlhy z 1. svetovej vojny spôsobili, že medzinárodný finančný systém v roku 1920 oslabil, no skutočné problémy nastali až v polovici roka 1928, kedy USA a Francúzsko začali priťahovať veľké množstvo zlata z celého sveta. To spôsobilo, že centrálne banky stratili zlaté rezervy, ktoré potrebovali späť na krytie ich meny čo viedlo k reštrikcii monetárnej politiky. Okrem toho tieto obmedzujúce politiky viedli k nástupu celosvetovej deflácii v roku 1929.
Irwin, D. A. (2011) zdôraznil, že krajiny po vojne sa snažili znížiť infláciu a obnoviť menovú stabilitu, a tým aj položiť základy, ktoré by viedli k návratu k zlatému štandardu. Cassel predvídal, že riziko deflácie je úzko spojené s návratom k zlatému štandardu. Keď sa krajiny vrátili k zlatému štandardu, to spôsobilo fixáciu nominálnej ceny zlata pokiaľ ide o menu. V prípade, že dopyt po zlate sa zvýši, pevná nominálna cena by nemala byť prispôsobená. Inak povedané, skôr než porastie cena zlata, ceny ostatného tovaru budú musieť klesnúť, čoho výsledkom bude deflácia cenovej hladiny.
Preto hodnota zlata, teda udržateľnosť celkovej cenovej hladiny, na to, aby bola stabilná, zásoby zlata resp. ponuka zlata by musela byť v súlade v dopytom po zlate. Cassel, G. upozornil, že pokiaľ sa krajina vráti k zlatému štandardu, centrálne banky zvýšia svoj dopyt po zlatých rezervách, a to povedie k nárastu dopytu po zlate rýchlejšie ako samotná ponuka zlata, čím vznikne deflácia.
Z iného pohľadu, Hayek súhlasil s Cassel G., že zlé riadenie zlatého štandardu bolo zdrojom problémov vo svetovej ekonomike v dvadsiatych rokoch 20. storočia. Hayek ozrejmil, že ekonomický kolaps v 1929 bol nevyhnutným dôsledkom inflačného boomu vďaka lacným úverom, ktoré vznikli preto, že krajine sa nepodarilo dodržiavať pravidlá zlatého štandardu. Akýkoľvek pokus o zmiernenie bolesti dopadov s ďalšími inflačnými opatreniami by jednoducho viedli ešte k väčšiemu poklesu.
Inak povedané, tieto globálne toky ovplyvnili miestne politiky. Krajiny so zlatým štandardom slúžili ako dáždnik stability kapitálových tokov pre obchod s komoditami. Už v roku 1880, najväčšie krajiny sa snažili zbaviť striebra a bimetalových kovov a neskôr v roku 1900 krajiny ako Latinská Amerika, Ázia sa snažili urobiť to isté.
Aké závery je možno z toho vyvodiť? Po prvé, krízy boli všade prítomné, udalosti v období globalizácie predchádzali prvej svetovej vojne. Načŕta sa otázka či globalizácia bola primárnou príčinnou hospodárskej krízy. Je nutné uviesť, že prílev kapitálu ovplyvnili príčiny a dôsledky bankovej, menovej a dlhovej krízy. Tieto prílivy v spojení s ďalšími faktormi vytvorili finančnú krehkosť resp. zvýšený potenciál pre krízu.
Inak povedané, koncept peňazí, t.j. zlato a striebro v štandardnej hmotnosti a mince, umožnili svetovým ekonomikám rozšíriť a prosperovať. Počas klasického obdobia gréckej a rímskej vlády v západnom svete, za zlato a striebro dochádzalo k výmenám hlavne do Indie pre korenie a do Číny na hodváb.
Súčasná analýza
Podľa ročného reportu prezentovaného Scotia Bank, za rok 2014 najviac investícií smerovalo do Kanady a Kajmanských ostrovoch. Taktiež zaradili Bahamy, Bardados, Kajmanské ostrovy ako prvé podľa rebríčka Euromoney, z hľadiska prílevu súkromných investícií. Je potrebné dodať, že škótske fondy v Mexiku získali ocenenie ako najlepšie fondy publikované v Standard & Poor´s.
“Konkurenčný boj na trhu s ropou a železnou rudou spôsobil, že silný americký dolár oslabil zlato, a tým aj celkové ceny komodít v dolároch. Avšak, mierny rast cien ropy, na domácom aj medzinárodnom trhu, zdvihol všetky ceny v 2Q 2015,“ ozrejmila Patricia Mohr, viceprezidentka ekonómie a komoditný špecialista Scotia Bank. Taktiež dodáva, že ceny komodít na začiatku júla 2015 boli ovplyvnené obavami z gréckej dlhovej krízy a poklesu o 32% na akciových trhoch v Číne, ako aj prípadný návrat iránskej ropy na svetových trhoch.
Aktuálna hodnota zlata z dňa 29. júla predstavuje $1,090.25 za uncu, kým v roku 1970 bola hodnota $70, badateľný nárast o 557,5%. Kým v roku 2013 bola hodnota zlata na úrovni $1,204.50, v 2014 pozorujeme pokles o 4% na hodnotu $1,199.25 za uncu. Načŕta sa otázka aká je celková hodnota zlata po celom svete? Stručne $6,35 bilióna. Najväčší držitelia celosvetových rezerv v podobe zlata sú USA až 74%, Nemecko 68%, MMF, Taliansko 67% a Francúzsko 65% v 1Q 2015.
Podľa reportu World Gold Council, v 1Q 2014 bol rekordný dopyt pre čínske šperky, 236t, čo je veľmi vysoký benchmark. Na druhej strane, v 1Q 2015 Čína prekročila svoj päťročný priemer o 27%, z toho vyplýva, rastúci trend bude neohrozený. Zlato vyjadrené v tureckej líre vzrástlo v 1Q 2015, hlavne kvôli predaju mien investormi vzhľadom na ekonomické a politické záujmy. Rekordné ceny sa vyšplhali až na 85t zlata, nárast o 21% oproti 1Q 2014, z toho vyplýva, že zlato bude aj naďalej hrať úlohu likvidného aktíva, ktoré môžu investori ľahko predať v časoch ekonomickej tiesni.
Z pohľadu jednotlivých krajín, kľúčové Čína a India, v Indii sa zvýšil dopyt o 27t oproti 1Q 2014, dopyt po šperkoch poklesol vzhľadom na podmienky na trhu, ekonomický rast či fluktuácia cien. Dopyt po šperkoch v Číne poklesol o 10% oproti 1Q 2014, vzhľadom na spomalenie rastu HDP, situácia na akciových trhoch, opatrný výhľad cien zlata. Celkovo 620.2t zlata v 1Q 2014 držia investori po celom svete ako uvádza World Gold Council. Nízky dopyt po zlate resp. šperkoch je hlavne na blízkom východe, pokles o 31% oproti 1Q 2014 v Egypte, o 8% v Dubai či o 28% v Turecku. Celková ponuka zlata v 1Q 2015 je na úrovni 1,090t.
Investície do komodít, po globálnej finančnej kríze, dosiahli najvyššie ceny v roku 2011, ťahané hlavne dopytom zo strany Číny. Vzhľadom na dlhovú krízu v eurozóne a globálnu neurčitosť, v kombinácii s väčšou ponukou kovov a minerálov viedlo k poklesu cien komodít za posledné 3 roky.
Podľa prieskumu, ktorý uskutočnila PWC 2015, sa ukázalo, že 20% opýtaných spoločností vyjadrili súhlas, že cena zlata sa zvýši do 12 mesiacov, čo je pokles zo 47% oproti 2014 a 88% pokles oproti roku 2013. Podľa predikcií PWC sa cena zlata pre rok 2016 odhaduje na 1,280 USD za uncu. Čo sa týka nákladov, spoločnosti sa snažia znížiť náklady vzhľadom na nižšie ceny zlata. Na prieskum PWC 48% odpovedalo, že ich náklady sa znížia oproti 2014, 39% odpovedalo, že náklady ostanú na rovnakej úrovni a 13% odpovedalo, že ich náklady sa zvýšia. Spoločnosti sa snažia stabilizovať trh a získať dôveru investorov o komodity.
„V súčasných časoch, keď cena zlata sa kolíše smerom nadol, sú spoločnosti, ktoré sa snažia investovať do iných aktív, splatiť ich dlh, konať múdrejšie a produkovať viac peňazí,“ uviedol Graham, riaditeľ Harmony Golg Mining, jeden z najväčších producentov zlata na svete. Harmony uskutočňuje operácie v Južnej Afrike a v Papua Nová Guinei, kde vyprodukovali až 1,17 miliónov uncí zlata v roku 2014, 3% nárast oproti roku 2013.
Na záver, môžeme dodať, že investori, najmä na západe, budú stále investovať do kúpy zlata, nikdy nestratí na svojej hodnote. Taktiež sa vnára otázka, čo by mohlo zvýšiť záujem o zlato do budúcnosti? Jednoduchá odpoveď, monetarizácia zlata. Inak povedané, ak veritelia z rozvinutých krajín skúpia väčšie množstvo zlata, pretože sa boja nekrytých peňazí, potom ich dlh bude znehodnotený, tým pádom ceny zlata porastú. Čiže každý investor by mal mať vo svojom portfóliu zahrnuté investície do komodít. Inak povedané, koncept peňazí, t.j. zlato a striebro v štandardnej hmotnosti a mince, umožnili svetovým ekonomikám rozšíriť a prosperovať. Aj počas klasického obdobia gréckej a rímskej vlády v západnom svete, za zlato a striebro dochádzalo k výmenám hlavne do Indie pre korenie a do Číny na hodváb.
Offshore centers; Daňové raje

Perspektíva daňových rajov = Just an example of my style of writing for articles, research papers, case sudies learned by myself.
Keďže každý podnik má snahu dosahovať a maximalizovať zisky vo svojom podnikaní, má povinnosť odvádzať dane do štátneho rozpočtu, čo pre firmu znamená značný náklad. Z čoho vyplýva, že podniky hľadajú cesty ako znížiť náklady a minimalizovať daňové zaťaženie. Inak povedané, v súčasnej globalizícii sa krajiny snažia prilákať investície do svojej krajiny pomocou optimalizácie daňového zaťaženia osôb resp. spoločností.
Medzinárodný menový fond definuje offshore centrá (ďalej daňové raje) ako jurisdikcie, ktoré majú pomerne veľký počet finančných inštitúcií zaoberajúcich sa predovšetkým nerezidentmi, strediská, ktoré poskytujú nízke alebo nulové zdanenie, strednú finančnú reguláciu a bankové tajomstvo spojené s anonymitou.
Aký je počet slovenských spoločností v daňových rajoch?
Podľa poradenskej spoločnosti Bisnode, ktorá monitoruje 20 daňových rajov, na konci roka 2014 dosiahol počet 4 266 a medziročne sa zvýšil o 9,3 %, čo znamená nárast o 364 spoločností, o 152 spoločností viac ako v roku 2013. Badateľný nárast spoločností v 2014 o 49,89% v porovnaní s rokom 2010. Počet slovenských spoločností sa zvýšil v Spojených štátoch amerických, Paname, Luxembursku či Holandsku. Celkové aktíva 4 266 spoločností v daňových rajoch sú v hodnote 8,3 mld € v 2014, podľa aktív hlavne v Holandsku, Luxembursku a na Cypre.
„Krivka záujmu podnikateľov o daňové raje bola v roku 2014 veľmi dynamická. Zatiaľ čo v prvom polroku firmy s vlastníkom v daňovom raji pribúdali ako „huby po daždi,“ posledný kvartál došlo dokonca k poklesu celkového počtu spoločností,“ zdôraznil Milan Seliak z Bisnode. Je to možné pripísať aj vďaka tomu, že viaceré krajiny rušia bankové tajomstvo či dokonca zavádzajú zrážkové dane.
S rozšírením daňových rajov úzko súvisí korupcia, avšak pranie špinavých peňazí v daňových rajoch je aj naďalej z veľkej časti nepreskúmaný fenomén vo svetovej ekonomike, inak povedané round-trip investície, teda prevod finančných prostriedkov do zahraničia za účelom, aby sa reinvestovali niektoré alebo všetky investície do domovskej krajiny v podobe zahraničných investícií.
Už v dvadsiatych a tridsiatych rokoch 20. st. sa daňové zvýhodňovanie sústreďovalo v karibskej oblasti. Aké sú výhody využitia daňových rajov? Sú to predovšetkým daňová optimalizácia, ochrana majetku, utajenie informácií, obmedzenie zákonných povinností a nevyžadujú sa daňové priznania. Je dôležité uviesť, že investor taktiež zvažuje počet zmluv o dvojitom zdanení s rôznymi sadzbami v každej zemi alebo postoj k obchodovaniu s rezidentami. Z čoho vyplýva, že odlišné právne prostredie umožňuje založiť takú spoločnosť, ktorá by v inej krajine vôbec nemohla vzniknúť.
Pokiaľ sa zameriame na spoločnosti s daňovým zvýhodnením, je nutné uviesť, že poznáme nerezidentské a daňovo oslobodené spoločnosti. Nerezidentské sú charakteristické znížením alebo úplným odstránením daňových povinností s ohľadom na príjmy dosiahnuté mimo zemi svojho vzniku. Tieto typy spoločností sú najmä v Honkongu, Paname, Gibraltari, Kajmanských ostrovoch.
Čo prispelo k rozvoju daňových rajov? V každom prípade finančné centrá ako New York alebo Londýn. New York je často dávaný do súvislosti s rozvojom Kajmanských ostrovoch, Bermud či Baham. Na druhej strane, Londýn je často spájaný s rozvojom na ostrovoch Man, Jersey alebo Gibraltaru.
Kedy vznikali prvé nadnárodné spoločnosti?
S procesom globalizácie je spojený nárast vzniku nadnárodných spoločností. Už na začiatku 19. storočia vznikali v Európe podľa Michela Ghertmana (1996) dva typy spoločností, inak povedané „multinational corporations“ (MNC) alebo „transnational corporations“ (TNC), no významovo sa však nelíšia.
„Za nadnárodnú spoločnosť je považovaná každá spoločnosť so sídlom v jednej zemi a vyvíjajúcou stálou činnosťou pod svojou kontrolou najmenej vo dvoch ďalších zemiach, pričom v nich realizuje aspoň 10% svojho obratu. Spoločnosť vo svojej pôvodnej zemi sa nazýva materskou a jej pobočky sú zahraničnými filiálkami,“ uvádza Michel Ghertman.
Z toho vyplýva, že súkromné podniky, ktoré realizujú výskum, výrobu, predaj tovarov resp. služieb v rôznych častiach sveta sú považované za nadnárodné spoločnosti. Otázka znie, ako založiť pobočku resp. svoj vlastný podnik v zahraničí? Prostredníctvom priamych zahraničných investícií materského podniku vo forme akvizície t. j. odkúpenie alebo fúzie t. j. zlúčenie podnikov. Z geografického hľadiska, činnosť nadnárodných spoločností sa sústreďuje do oblasti Severnej Ameriky, Západnej Európy a Japonska.
V roku 2014 bol nárast o 169 nových spoločností v USA, v Paname sa zvýšil počet o 64 spoločností, v Luxembursku o 39 a v Holandsku o 30 podľa Bisnode. Najväčší záujem bol o Gibraltár, Panamu, Maltu a Lotyšsko z relatívneho hľadiska. Je potrebné uviesť, že klesol záujem investorov o krajiny ako Seychely či Cyprus.
Je dôležité uviesť, že význam nadnárodných spoločností stále rastie, lákavý faktor anonymity, podľa štúdie James S. Henry, bývalý hlavný ekonóm v spoločnosti McKinsey & Company, odhaduje, že 21 až 32 $ biliónov bolo v roku 2013 práve sútreďovaných v daňových rajoch, ekvivalent k veľkosti americkej a japonskej ekonomiky. Henry, ktorý je členom správnej rady pre daňovú spravodlivosť Network, výskum poukazuje, že aktíva spravované 50 najväčšími súkromnými bankami vzrástli z 5,4 $ bilióna v 2005 na viac ako 12 $ biliónov v roku 2013.
Čoho výsledkom je, že krajiny s nadnárodnými spoločnosťami stúpajú na ekonomickej sile, z čoho je zrejmé, že krajiny si môžu dovoliť vyberať podmienky pre svoju produkciu a zlacnieť tak výrobu. Z hľadiska šírenia technológií, výroby a výskumu, investície smerujú prevažne do rozvojových krajín, čo spôsobí zvýšenie zamestnanosti a zlepšenie sociálno- ekonomických faktorov v danej krajine.
Investori v roku 2014 investovali do základného kapitálu podnikateľských subjektov 8,4 mld € v oblasti obchodu, technických činností či nehnuteľností, ako uvádza Bisnode.
Ako môžeme jasne popísať daňové princípy? „Spravodlivosť, efektívnosť, pozitívne vplyvy na ekonomické správanie subjektov (t. j. daňové stimuly), správne pôsobenie na makroekonomické agregáty (t.j. makroekonomická pružnosť), právna perfektnosť a politická priehľadnosť,“ týchto päť kritérií dobrých daní uvádza Kveta Kubátová (2005).
Samozrejme dnešné daňové systémy a rôzne princípy vyplývajú už z historického vývoja. Ako prvé vznikali už v staroveku, resp. v stredoveku kedy sa začali formovať prvé panstvá a štáty. Čiže so vznikom štátu vznikli aj dane, ako príjem pre panovníka. Už Aristoteles v roku 300 p.n.l. sa venoval daňovej spravodlivosti a veľkosti daňového zaťaženia daňovníka. Neskôr Tomáš Akvinský v 13. st. poukázal, že daň je dobrovoľná lúpež pokiaľ je využívaná nepriamo t. j. neoprávnene pre panovníkove radovánky. Z iného pohľadu, Thomas Hobbes v 17. st. upozorňuje na princíp prospechu, t. j. dane sú protihodnota za služby poskytované jedincom štátom. Inak povedané, daň je cena za vykúpenie mieru v štáte.
Na dôležitosť daňovej konkurencie v oblasti medzinárodného obchodu poukázal už Adam Smith vo svojom diele s názvom Bohatstvo národov, kde uvádzal absolútne výhody, pri zohľadnení faktu, že jedna krajina je schopná vyprodukovať s rovnanými zdrojmi väčšie množstvo tovaru, za predpokladu, že štáty nezasahujú do fungovania tržného mechanizmu. Inak povedané názory liberalizmu a individualizmu. Komparatívne výhody boli prezentované neskôr Davidom Ricardom. Z čoho vyplýva, že jednotlivci majú svoje prirodzené práva a sloboda jednotlivca je tak predpokladom hospodárskej politiky.
Názory v oblasti daní sa neustále zdokonaľovali, Karel Marx upozorňoval, že redistribučná funkcia štátu závisí od typu hospodárského systému, čoho výsledkom je, že dane môžu plniť túto funkciu len v nepodstatných záležitostiach.
John S. Mill odporúčal, aby výška daní bola odvodená od schopnosti daňovníka dane platiť. Zdôrazňoval, že ľudia nie sú ochotní platiť za druhých, a preto je nutné zvoliť daňovú povinnoť podľa princípu rovnej obete. V súčasnej dobe známe pod názvom platobná schopnosť. Taktiež Arthur C. Pigou hľadal pomocou marginalistickej analýzy optimálnu veľkosť obetí jednotlivých daňovníkov.
V súčasnej dobe pozornosť ohľadom daňových rajoch je predmetom skúmania Offshore Investment, lídrom na trhu, journal je zameraný na investície v daňových rajoch pre spoločnosti, medzinárodných investorov a ich poradcov. Tento journal taktiež usporadúva rad konferenciíí, najbližšia sa uskutoční v septembri pod názvom The Oxford Offshore Symposium, kde sa stretnú odborníci z USA, Veľkej Británie, Írska, Indie, Švajčiarska, Kajmanských ostrovoch, Lichtenštajnska. Tento journal poskytuje a monitoruje informácie o 23 daňových rajoch po celom svete.
Autor:
Ing. Antónia Ficová
Working papers and PPTs

-
If you are extreme reader check on following website and following song:
-
http://www.slideshare.net/search/slideshow?searchfrom=header&q=antonia+ficova


You must be logged in to post a comment.